
What is a chromatogram?
A chromatogram is the graph that shows the data that we obtain when we analyze a sample. We use the data shown in the graph (see Figure 6) to determine which cannabinoids are present and estimate the concentration of each. We label the cannabinoids present in the sample, and we analyze the peak sizes, shapes, and space between them because they indicate useful information. In the chromatogram in Figure 6, the peaks are numbered, and a table lists the identities of the numbered peaks. For example, peaks number 11 and 12 are due to Delta-9-THC and Delta-8-THC, respectively, in this chromatogram:
HPLC chromatogram of a mixture of sixteen neutral and acidic cannabinoids
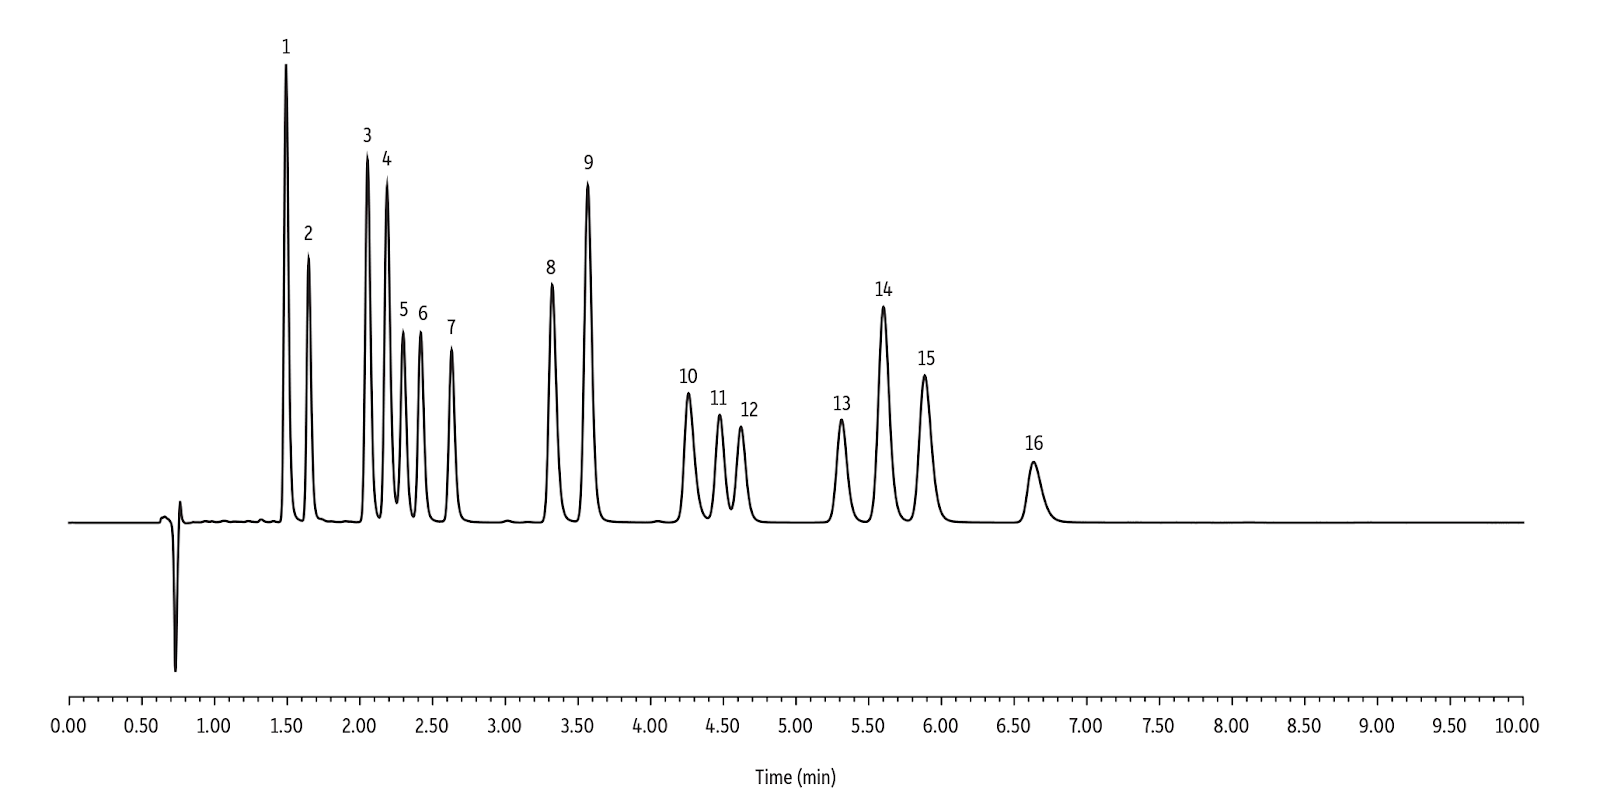
The vertical axis of the chromatogram shows the magnitude of the detector response whereas the horizontal axis shows the time (usually in minutes) from the start of the analysis to the end of the analysis for one test sample. The time at which a peak is observed in the chromatogram is the retention time for that substance and is characteristic of it. For example, Delta-8-THC has a characteristic retention time when analyzed by HPLC according to our standard operating procedure. Every time that we analyze a sample containing Delta-8-THC under those conditions, we expect to find it at that characteristic retention time. If the retention time changes more than the normal run to run variability, then we would know to stop the analysis and identify the reason for the changed retention time.
The retention time and the area under each peak are determined automatically by the software that comes with the analytical instrument. The area under the peak increases as the amount of the substance increases so the peak areas are necessary for determining the amount or concentration of each substance that is identified. The peak area for any identified substance (e.g., Delta-8-THC) in a test sample can be compared to the peak areas for calibrators prepared with that substance from reference standards at different concentrations. When the relationship between the peak areas and the concentrations in calibrators have been established, the concentration of the substance in the test sample can be calculated. Since different substances often produce different responses for the same amount of material, each substance needs to be quantified using calibrators prepared from reference standards of that substance. Therefore, if a substance is an unknown substance or one for which reference standards are not available, it cannot be quantified.